01
Integrate business reporting
Two full-stack engineers worked on React, TypeScript, Apache Superset and Apache ECharts. The dashboards brought restaurant operating data into visual reports for management.


Case study · Travel & hospitality
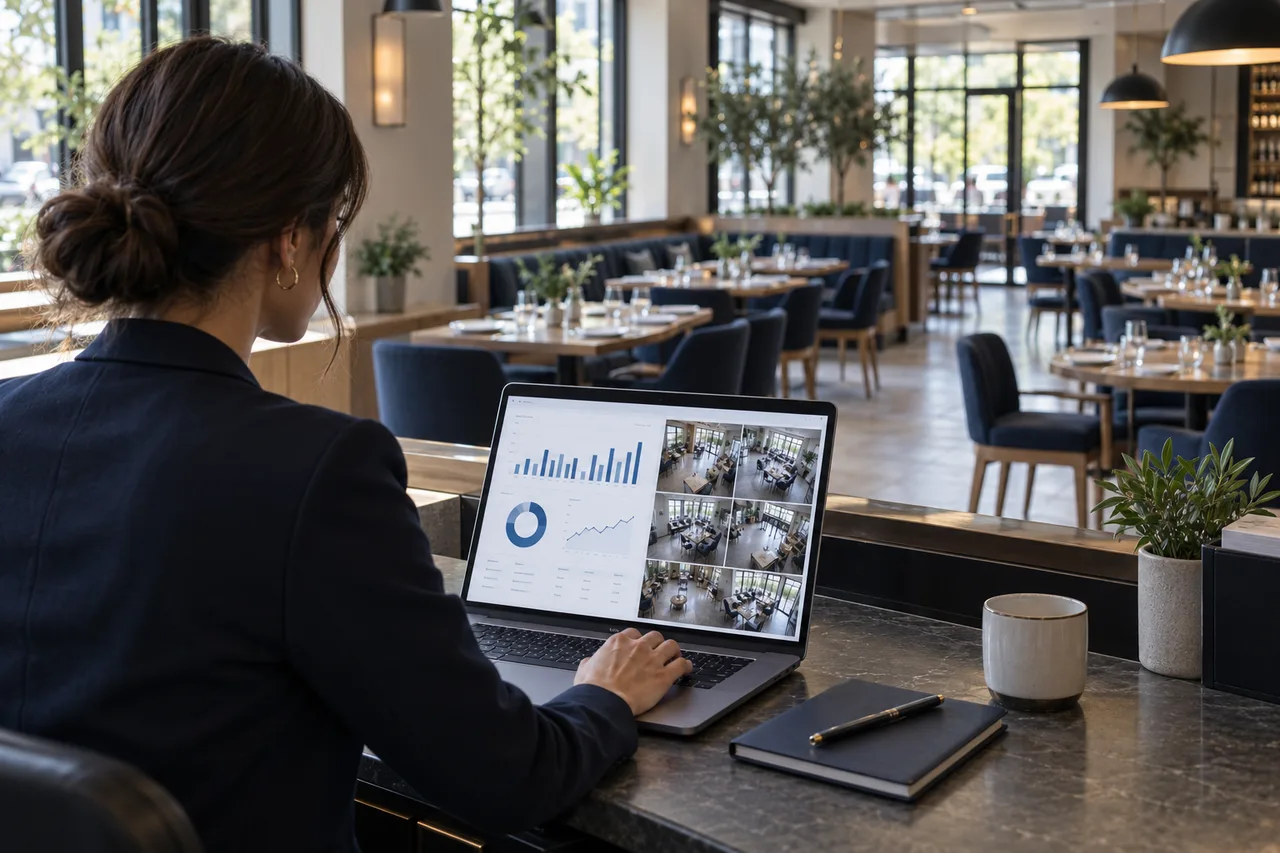
A US restaurant group combined sales and order reporting with remote camera monitoring, giving managers a shared view of operations across multiple locations.
The situation
As the restaurant group expanded, sales, delivery and order data became harder to interpret across locations. Manual inspections and spot checks offered limited coverage and delayed responses.
The client wanted centralised remote oversight alongside operational reporting. The project combined camera integration with the ability to explore business indicators such as revenue, order volume and average service time.
The approach
Two full-stack engineers worked on React, TypeScript, Apache Superset and Apache ECharts. The dashboards brought restaurant operating data into visual reports for management.
An AI engineer worked on camera-related analysis. The system supported video capture, storage, remote access and anomaly detection alongside the BI functions.
A modular architecture allowed components to be developed and improved independently. Data synchronisation kept reporting connected to activity across locations.
Project context
Technologies and working practices used in this engagement.
The result
The project record documents a successful release after one year of development and stable operation at the time of writing.
Managers could access sales, orders and service-time information through dashboards.
The client proposed extending the work to mobile access and additional analytics. Those proposals are separate from the delivered scope.
Tell us about your software, workflows and delivery requirements.
Discuss your project